



Overview:
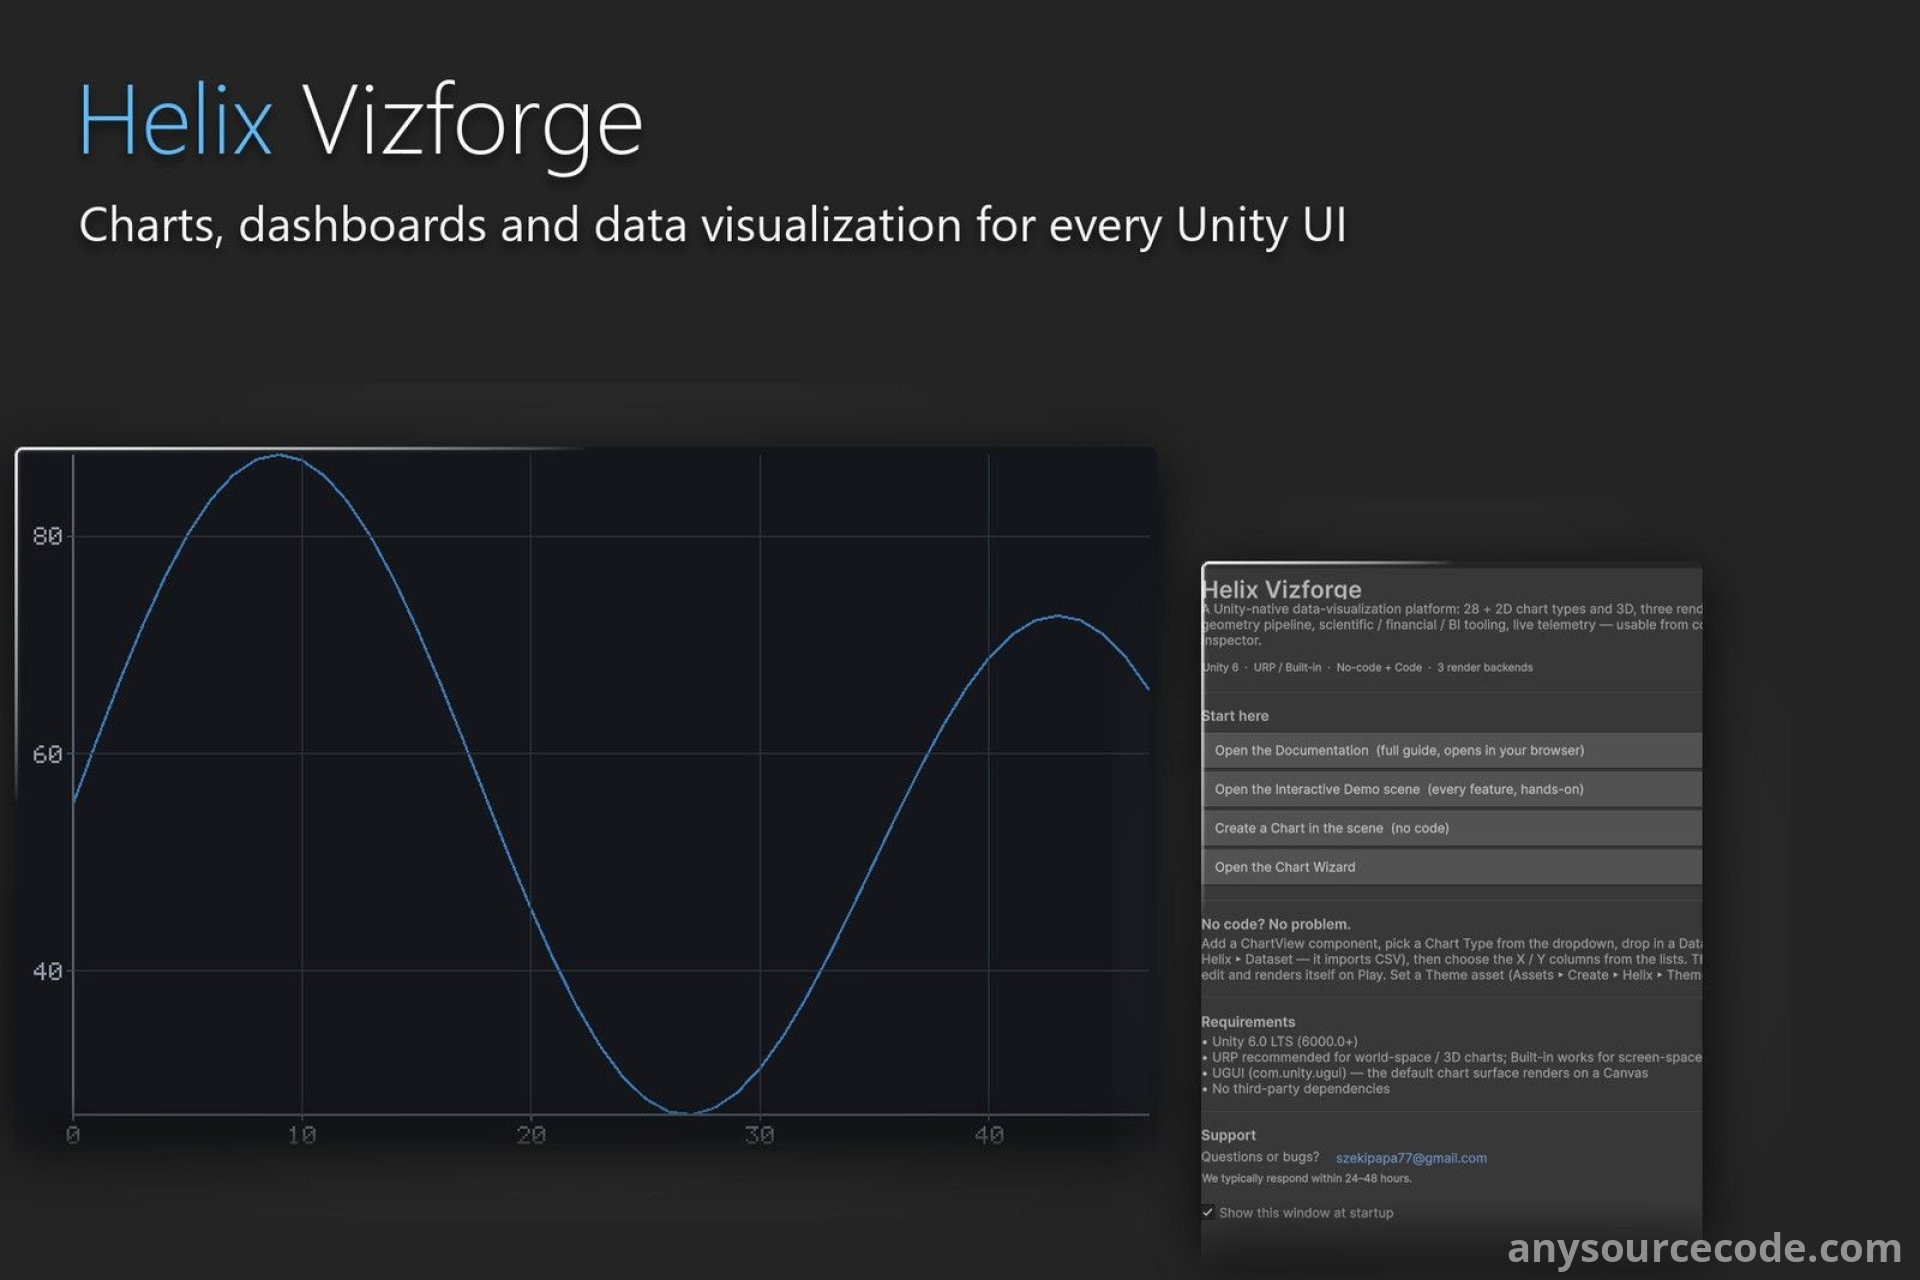
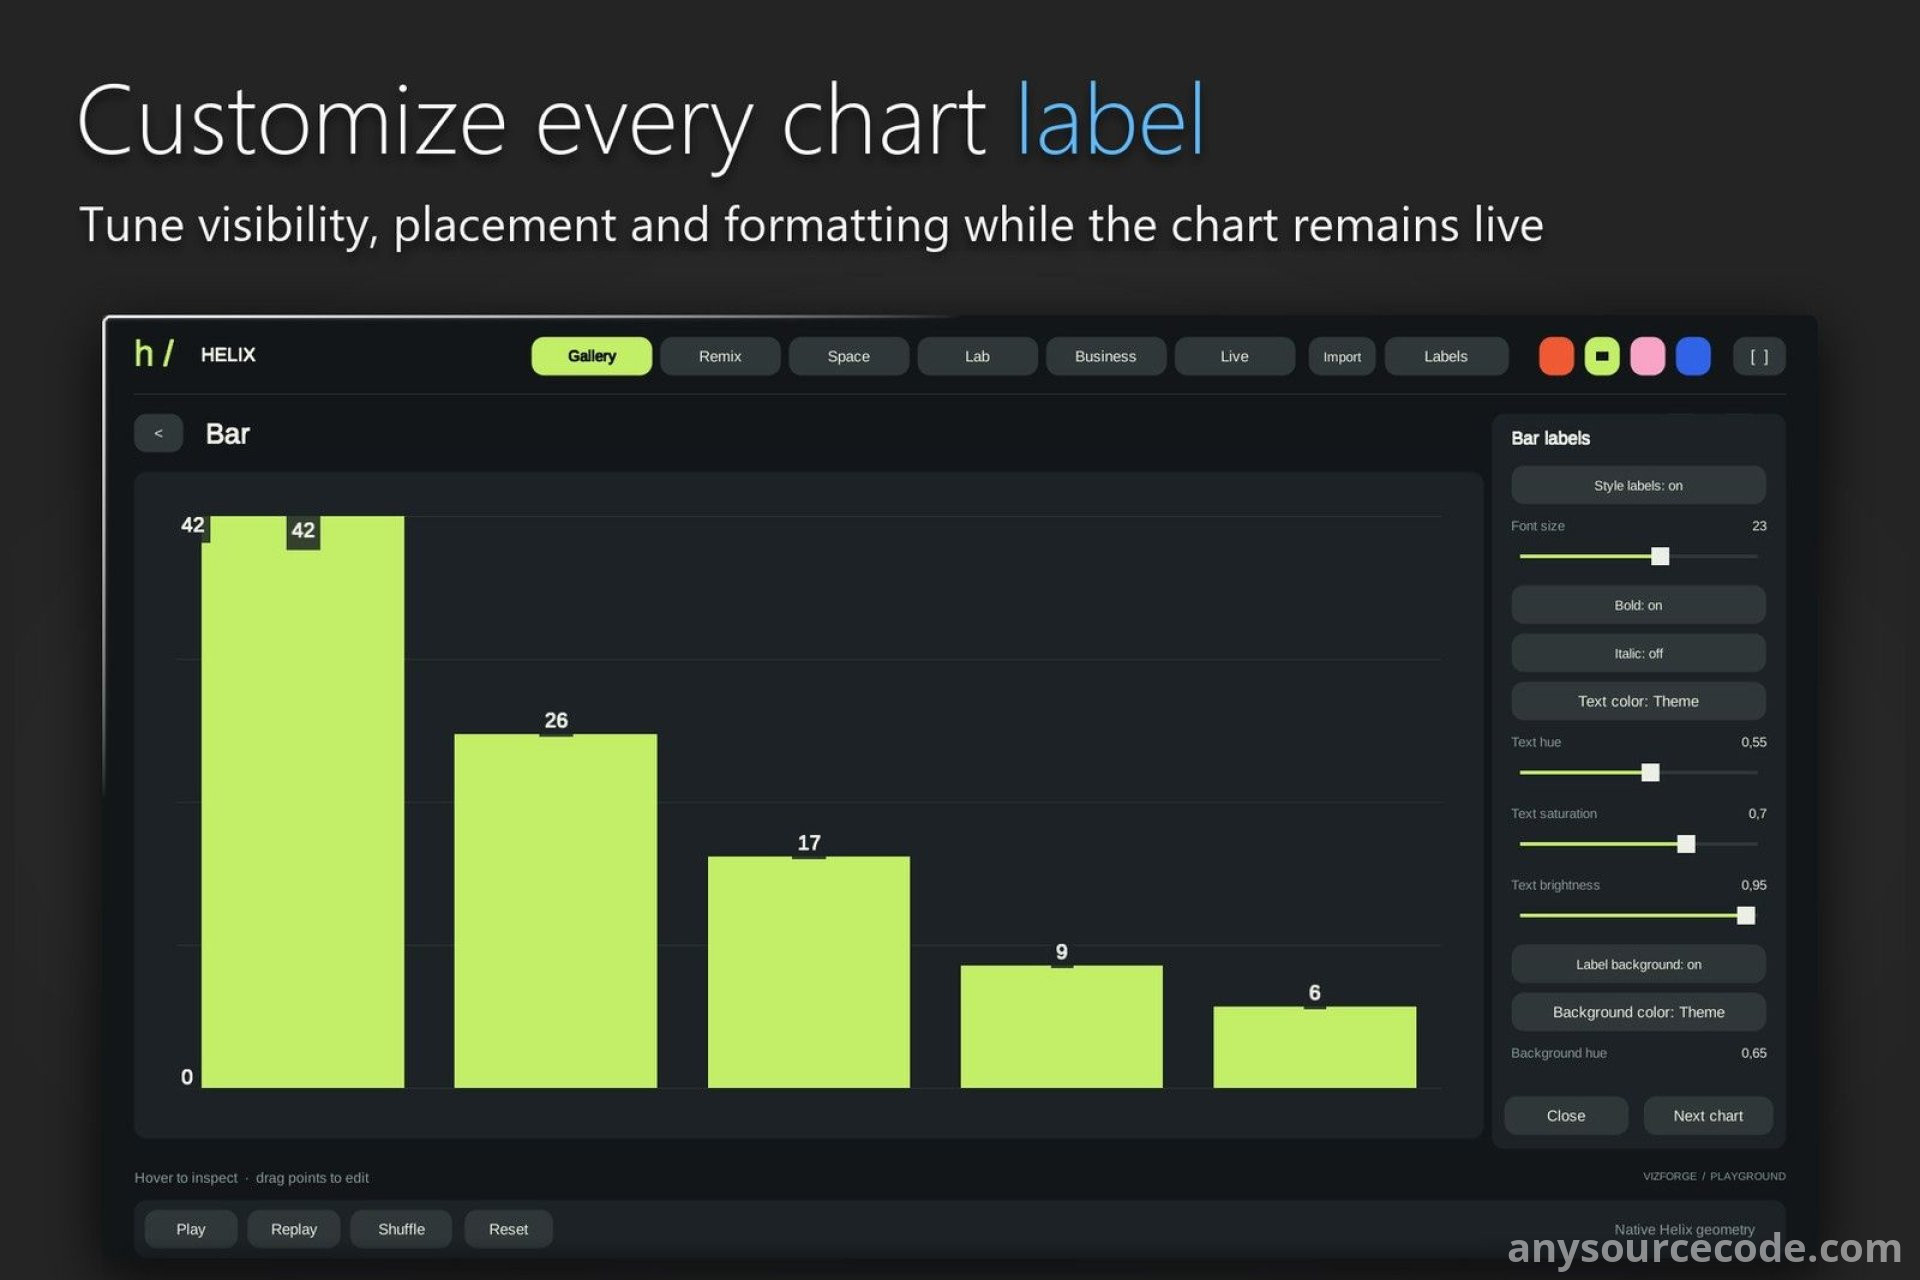
Helix Vizforge is a Unity charting and data-visualization framework for building interactive dashboards, financial panels, scientific plots, telemetry displays, and in-scene 3D visualizations. Its shared data model and rendering pipeline let you reuse chart definitions across Canvas interfaces, UI Toolkit, and world-space graphics.
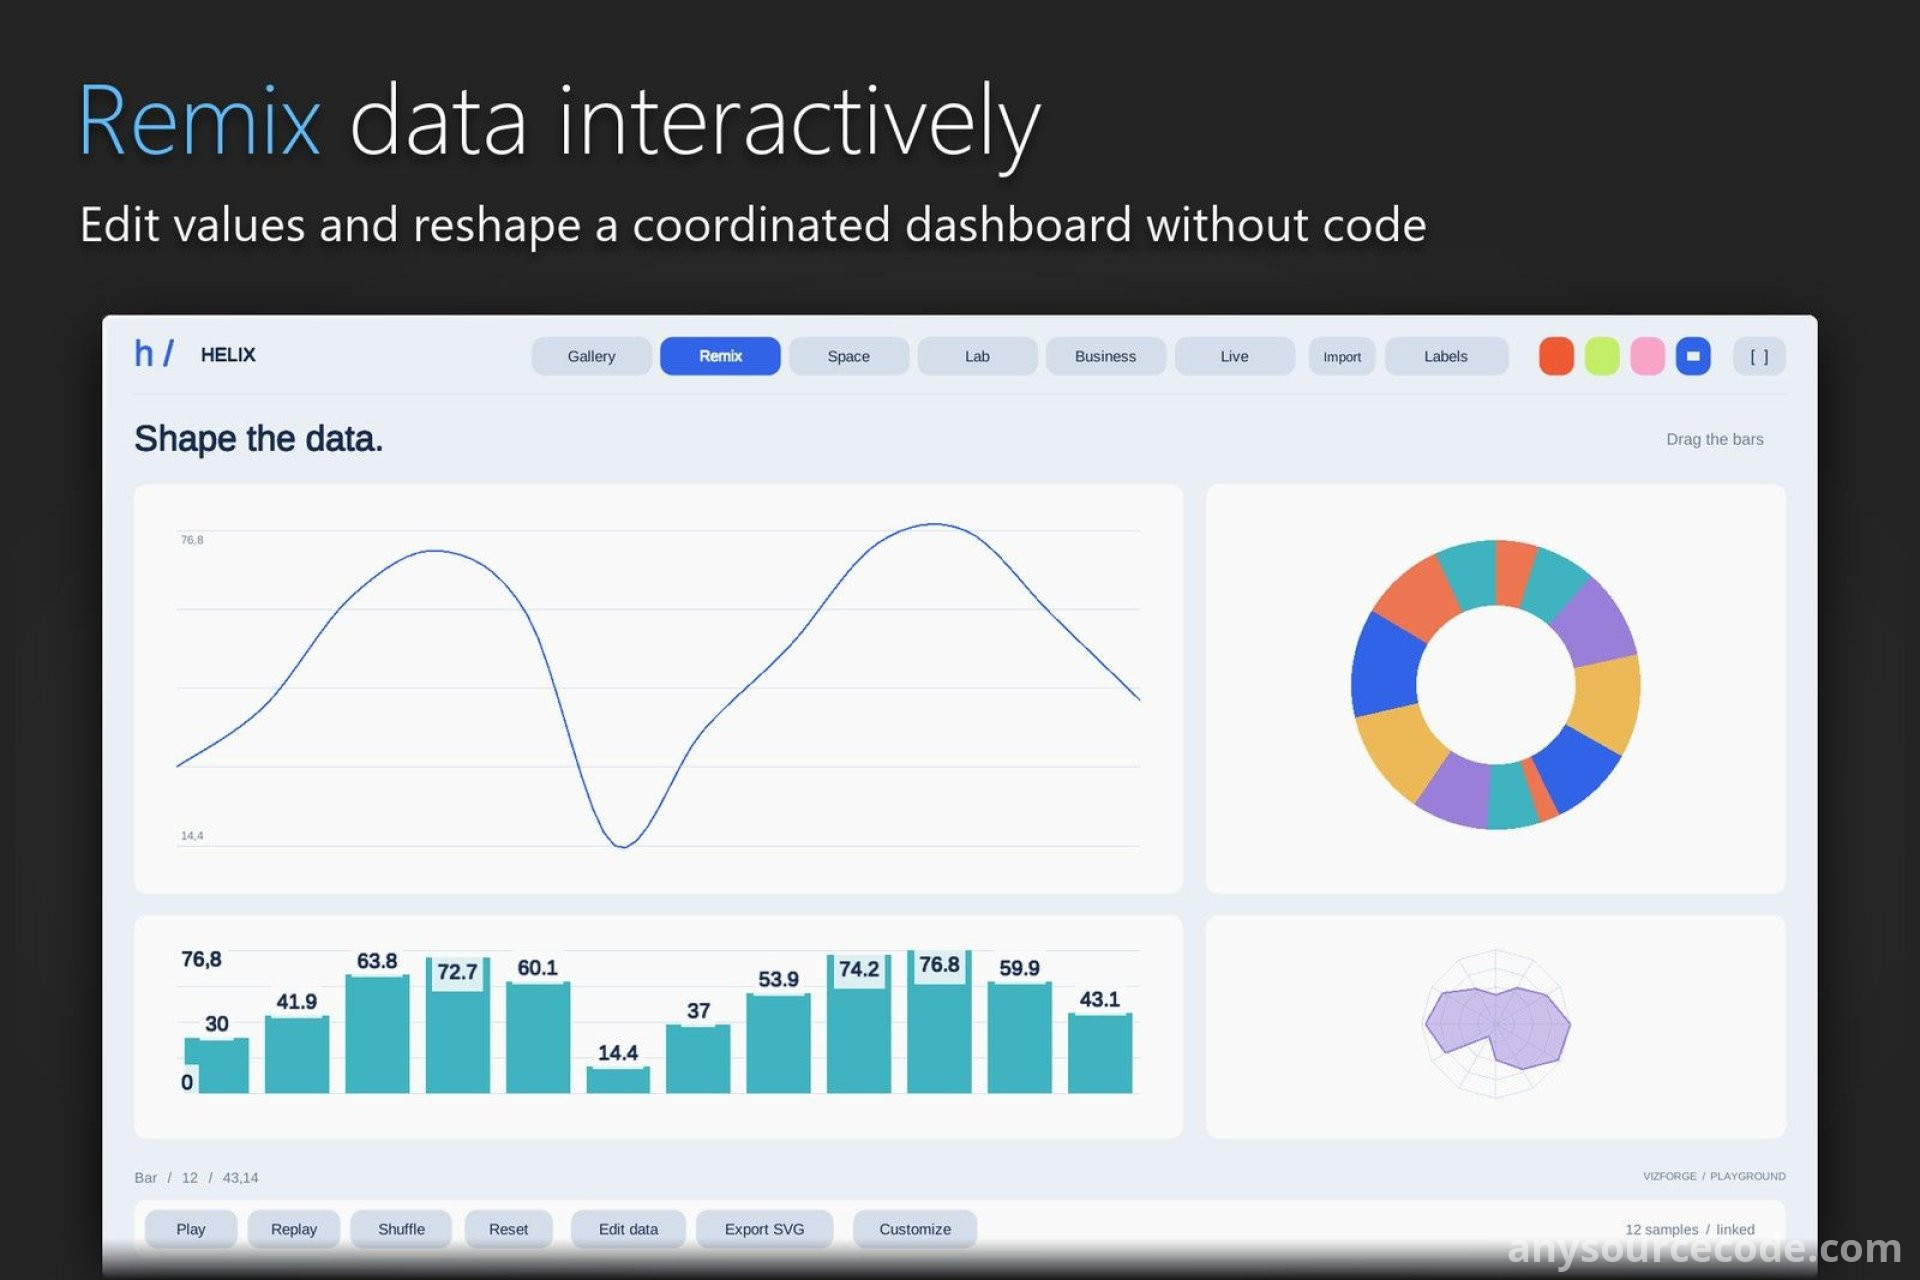
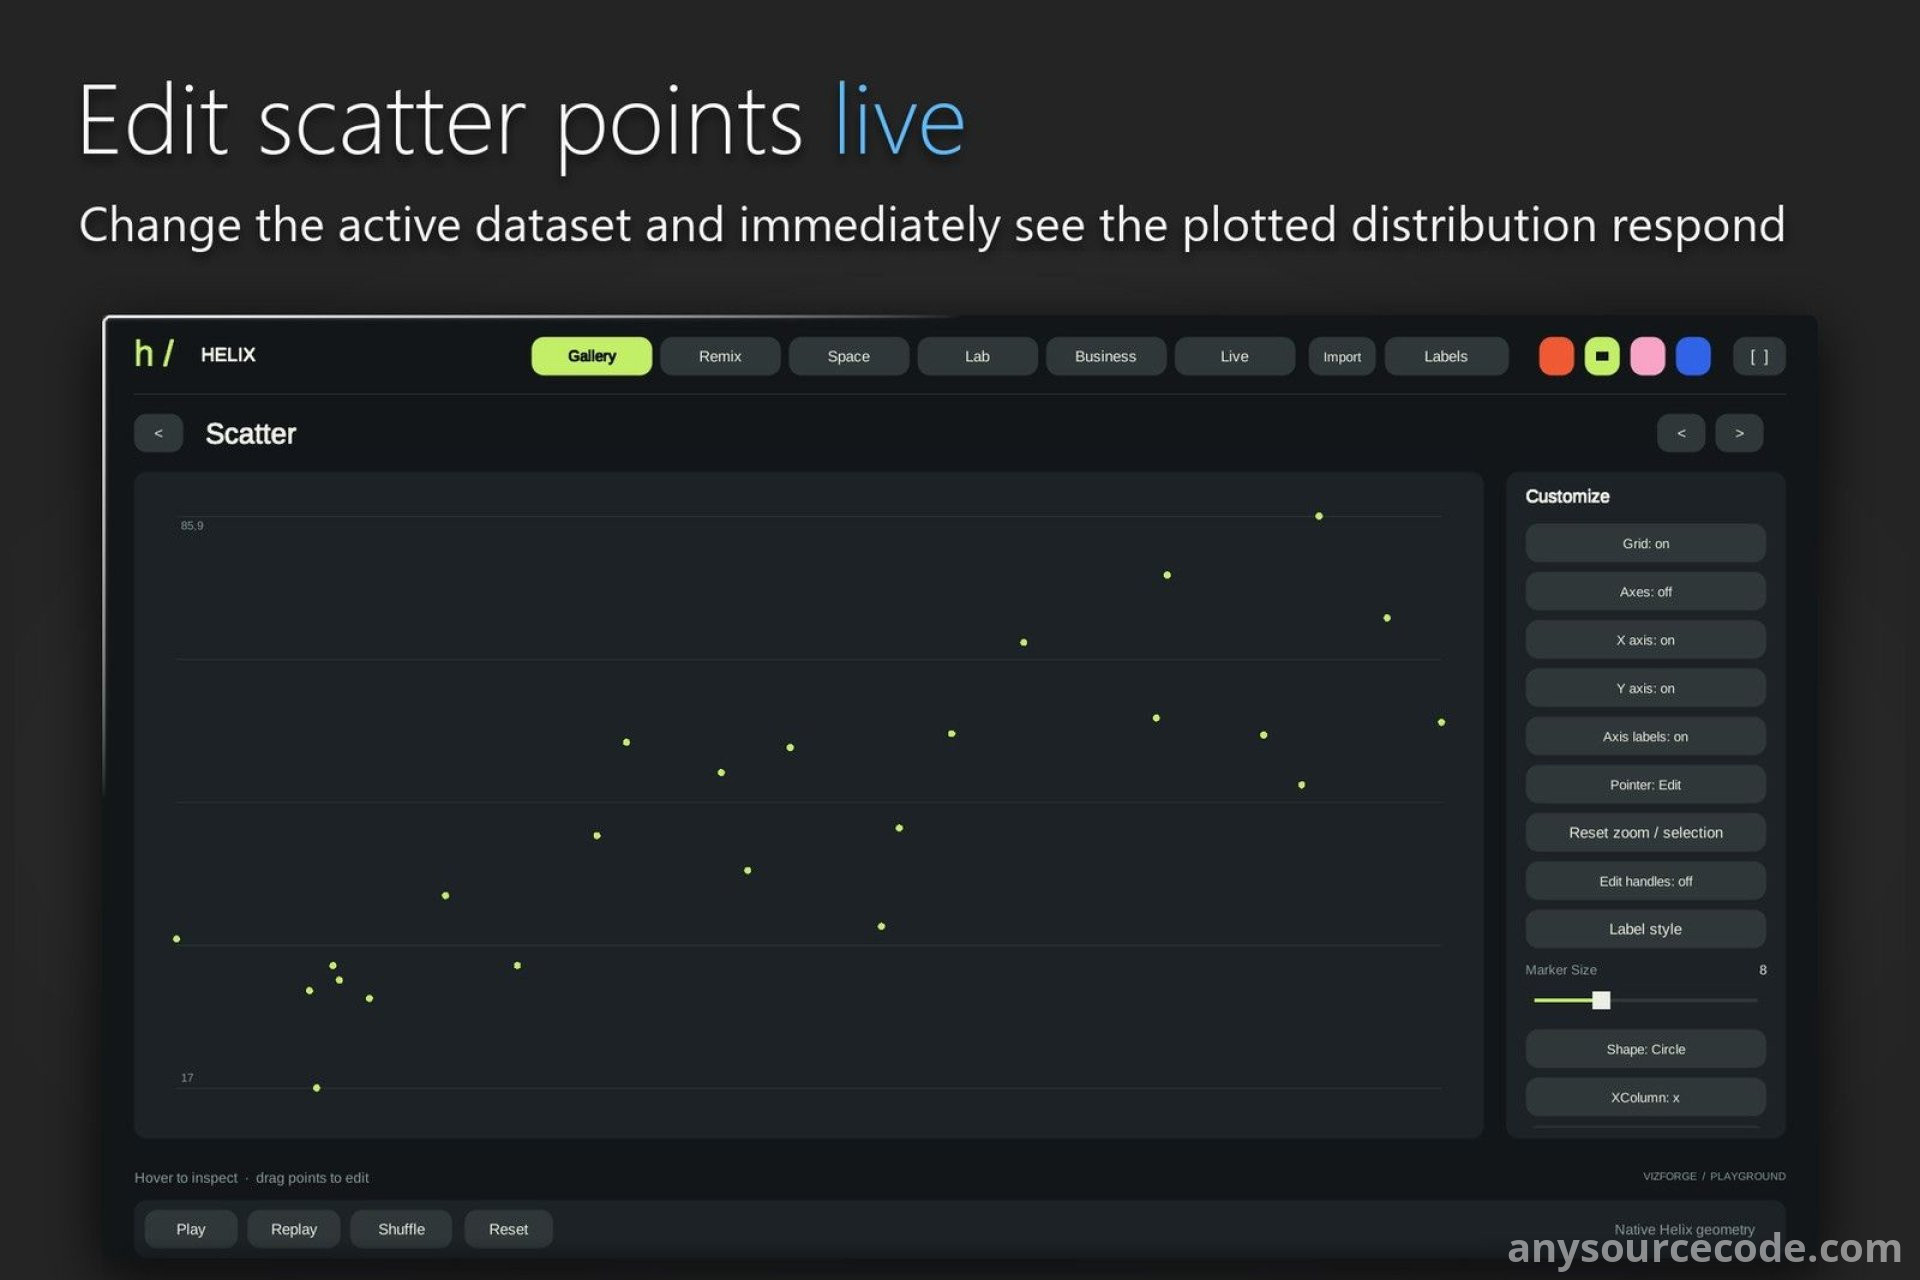
Create charts from typed datasets, customize their appearance with scales and themes, and add runtime interactions such as panning, zooming, hit testing, cross-filtering, and hierarchical drill-down. The framework also supports data analysis, continuously updating telemetry, and exportable reports for a range of visualization workflows.
Features:
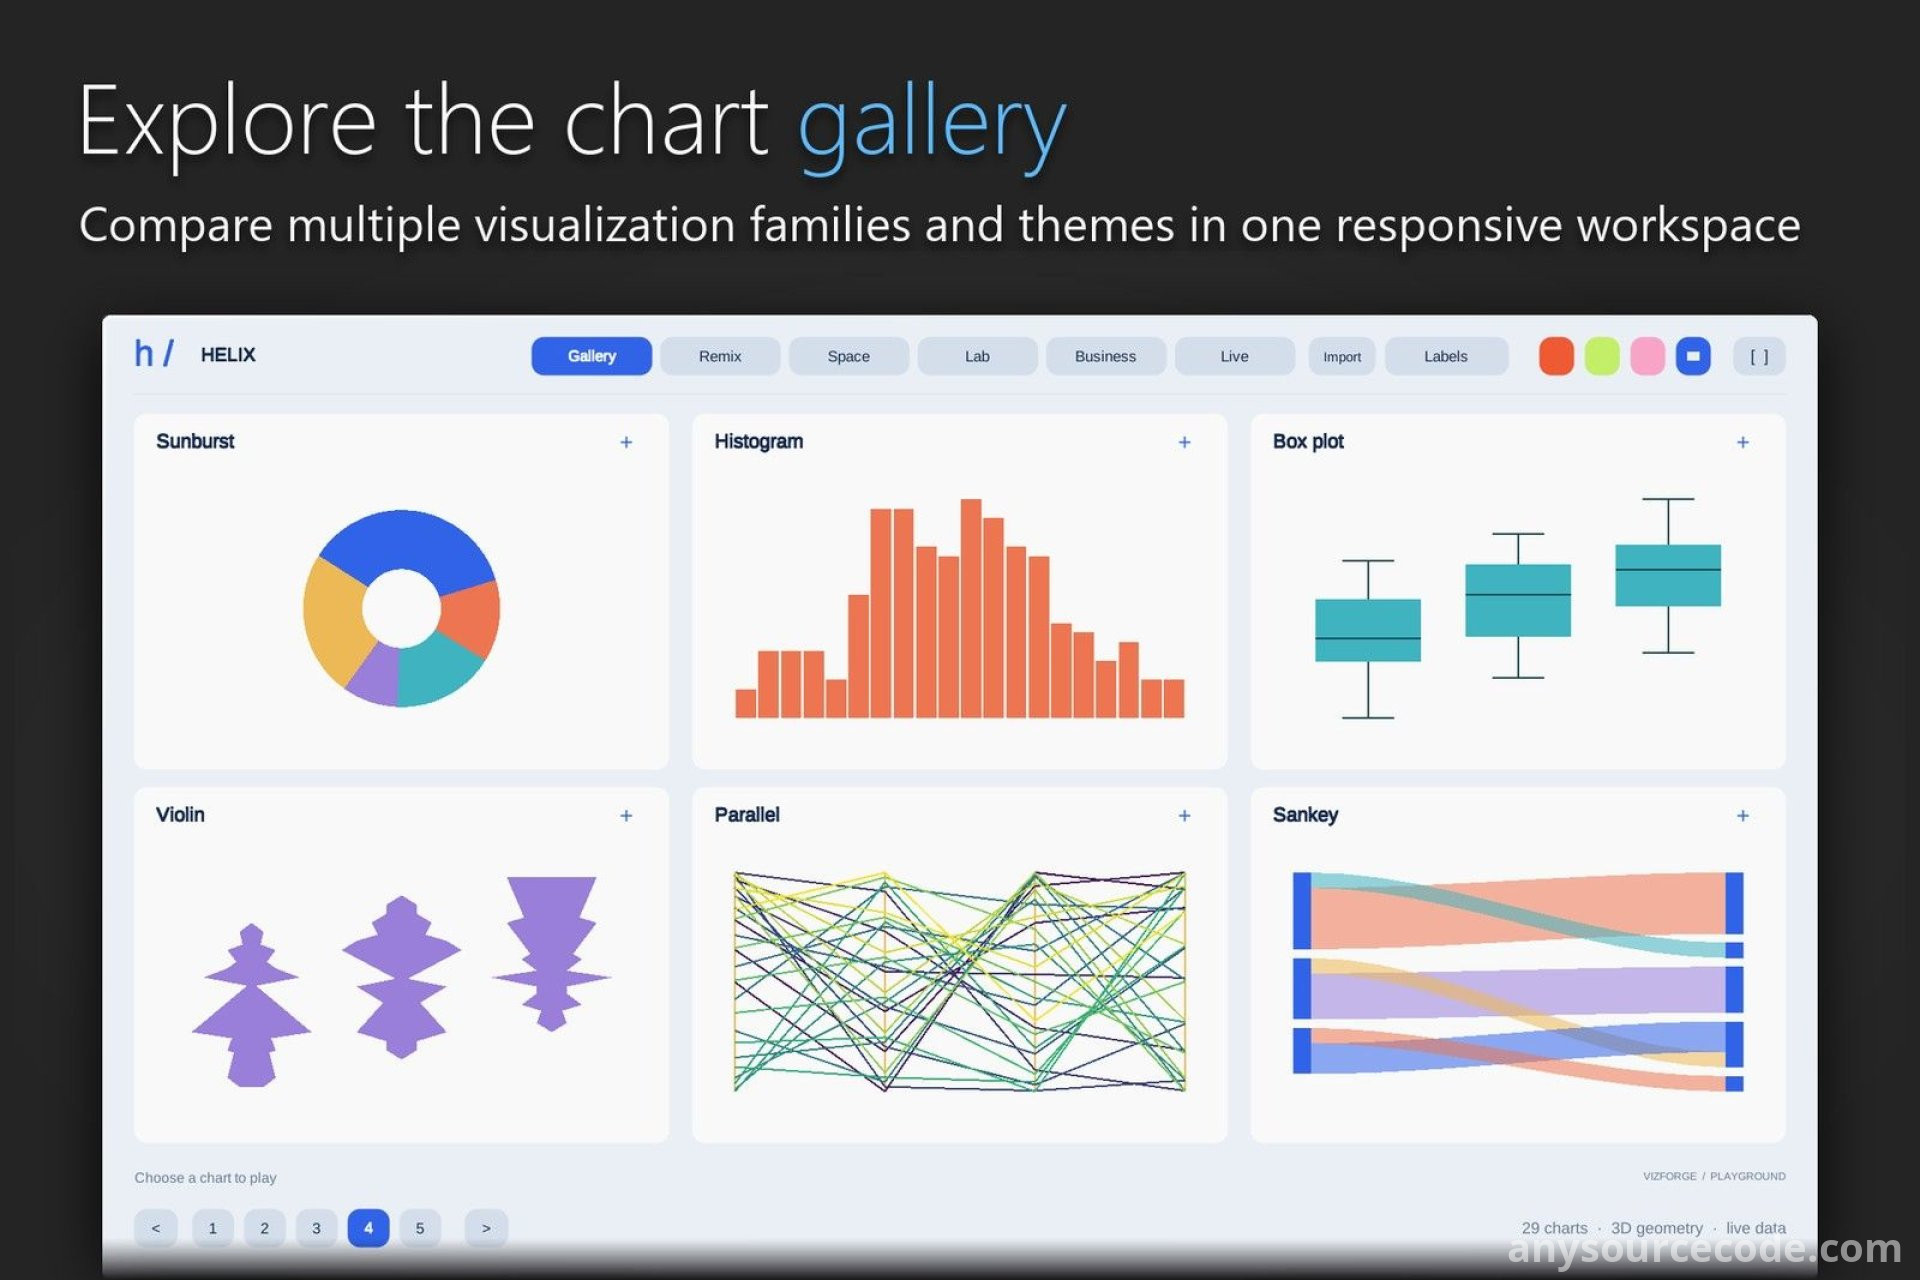
- Includes 28 core 2D chart generators, including line, area, bar, scatter, pie, radar, heatmap, Sankey, Gantt, box, and violin charts.
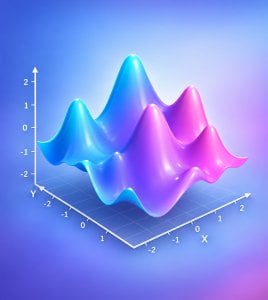
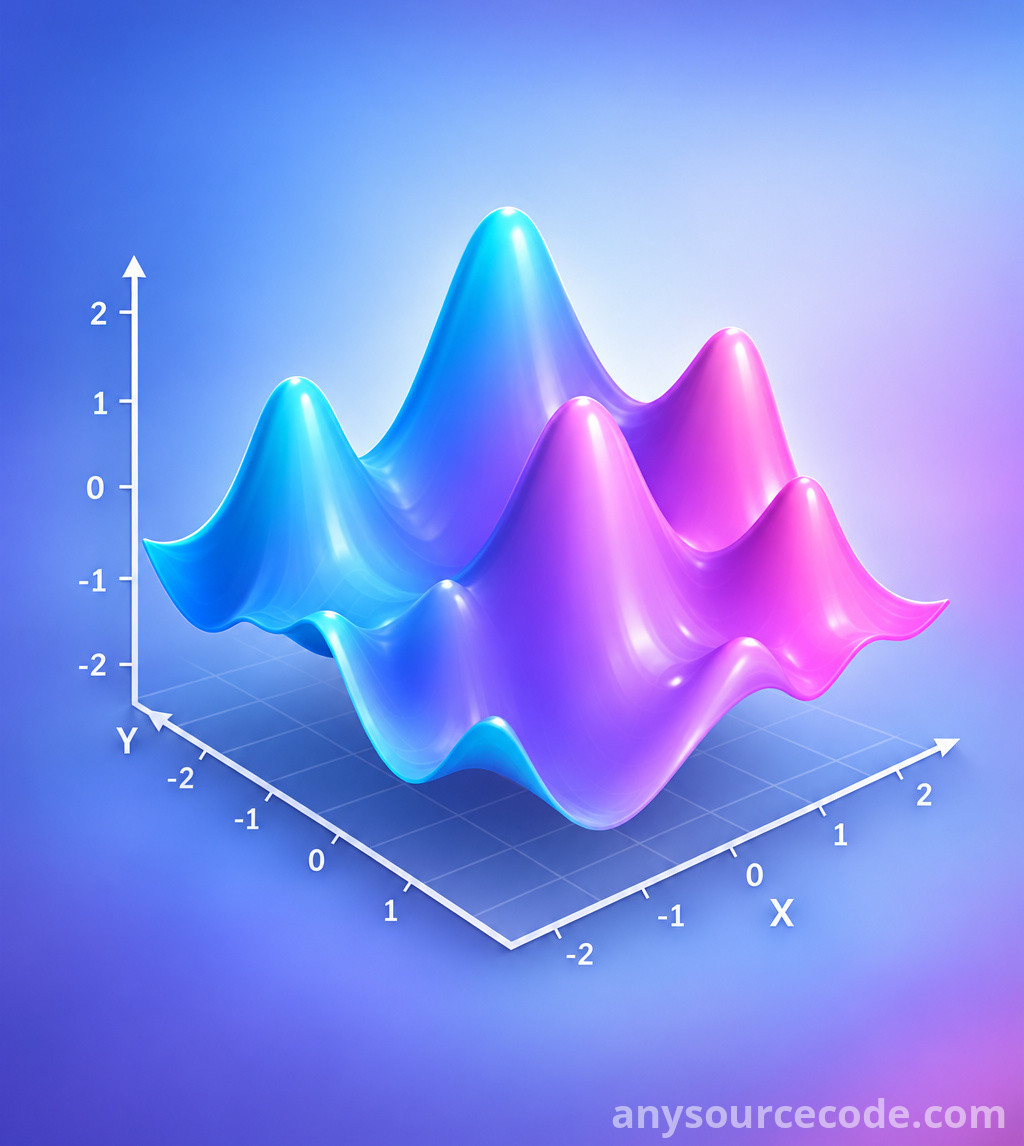
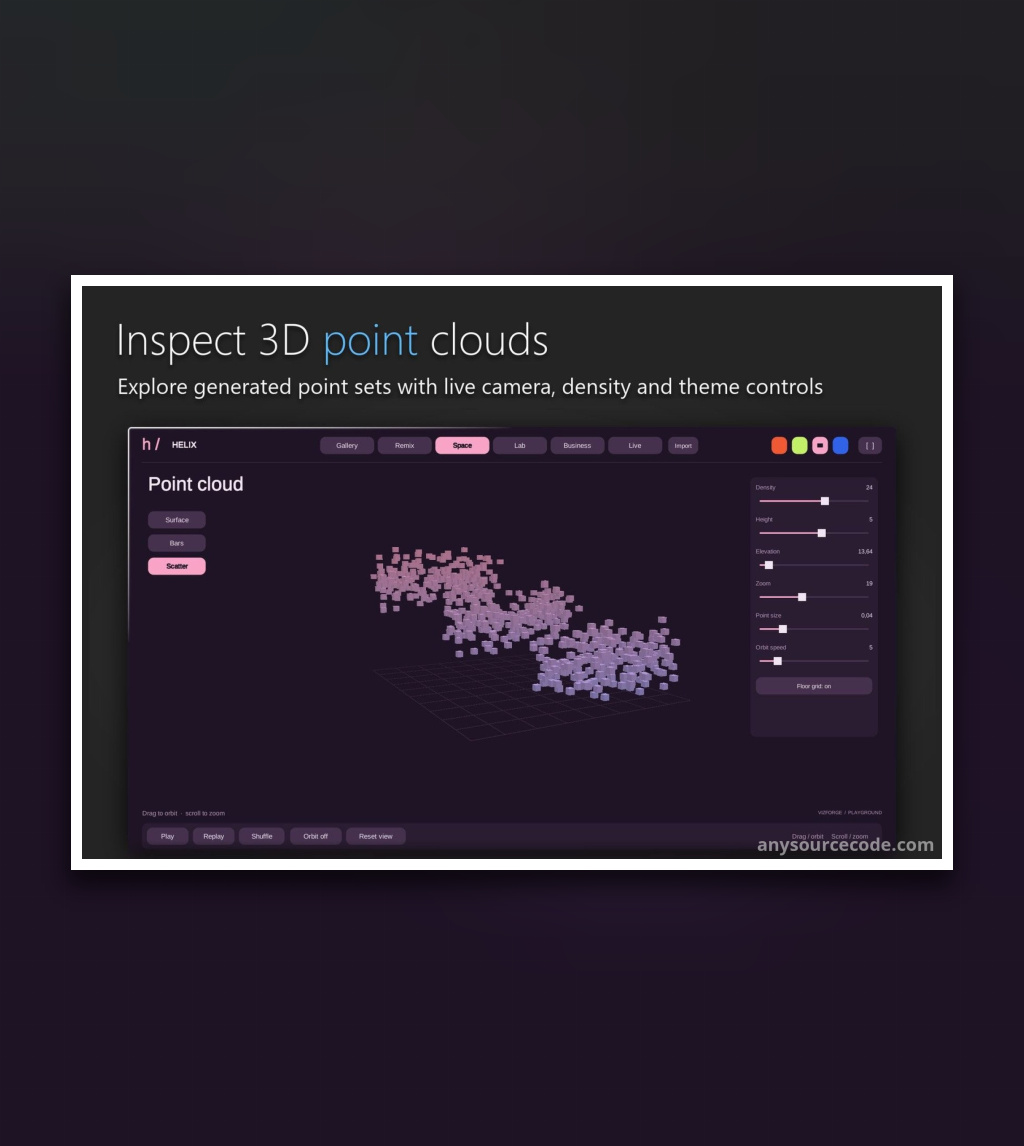
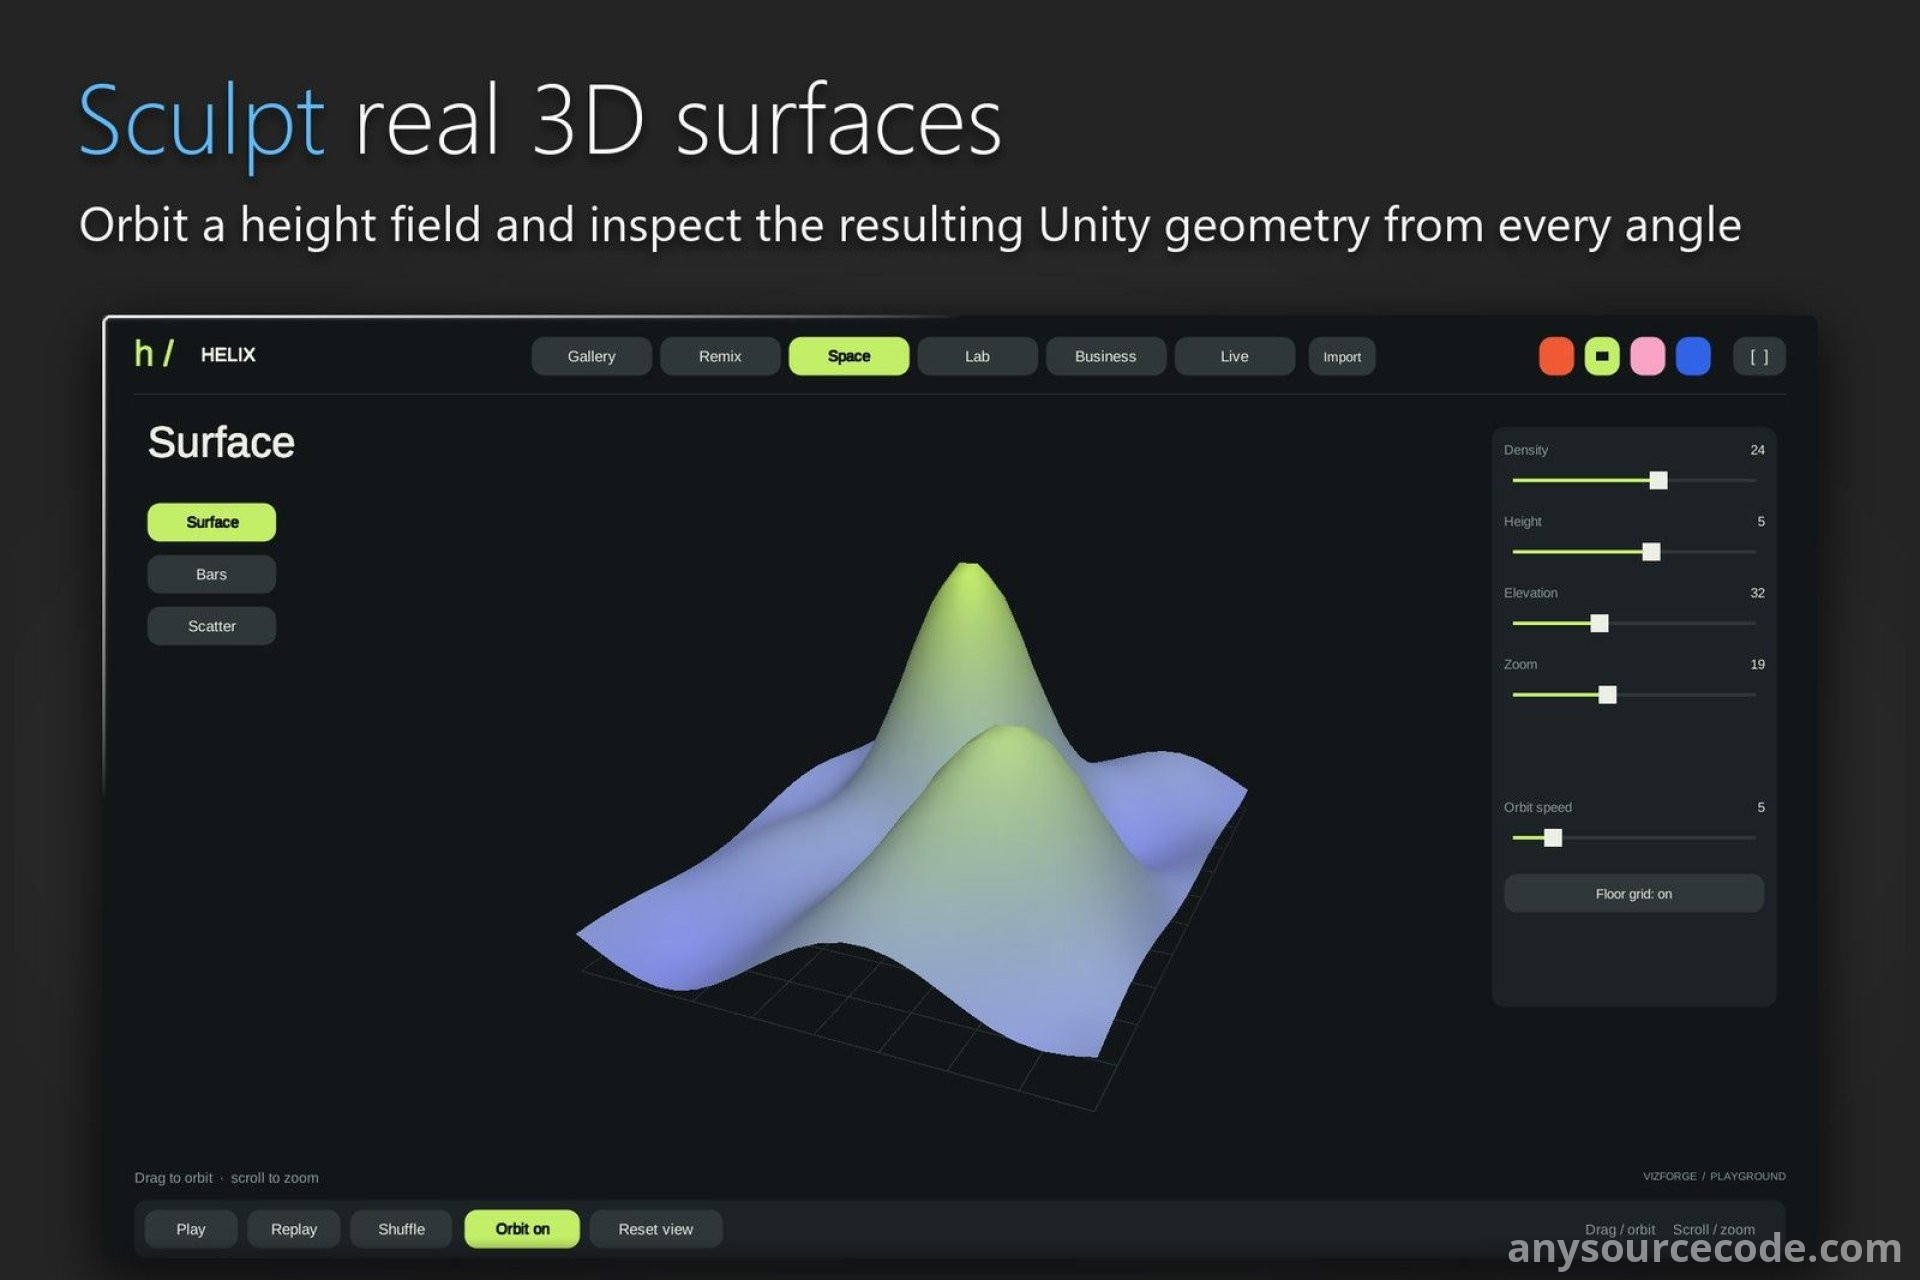
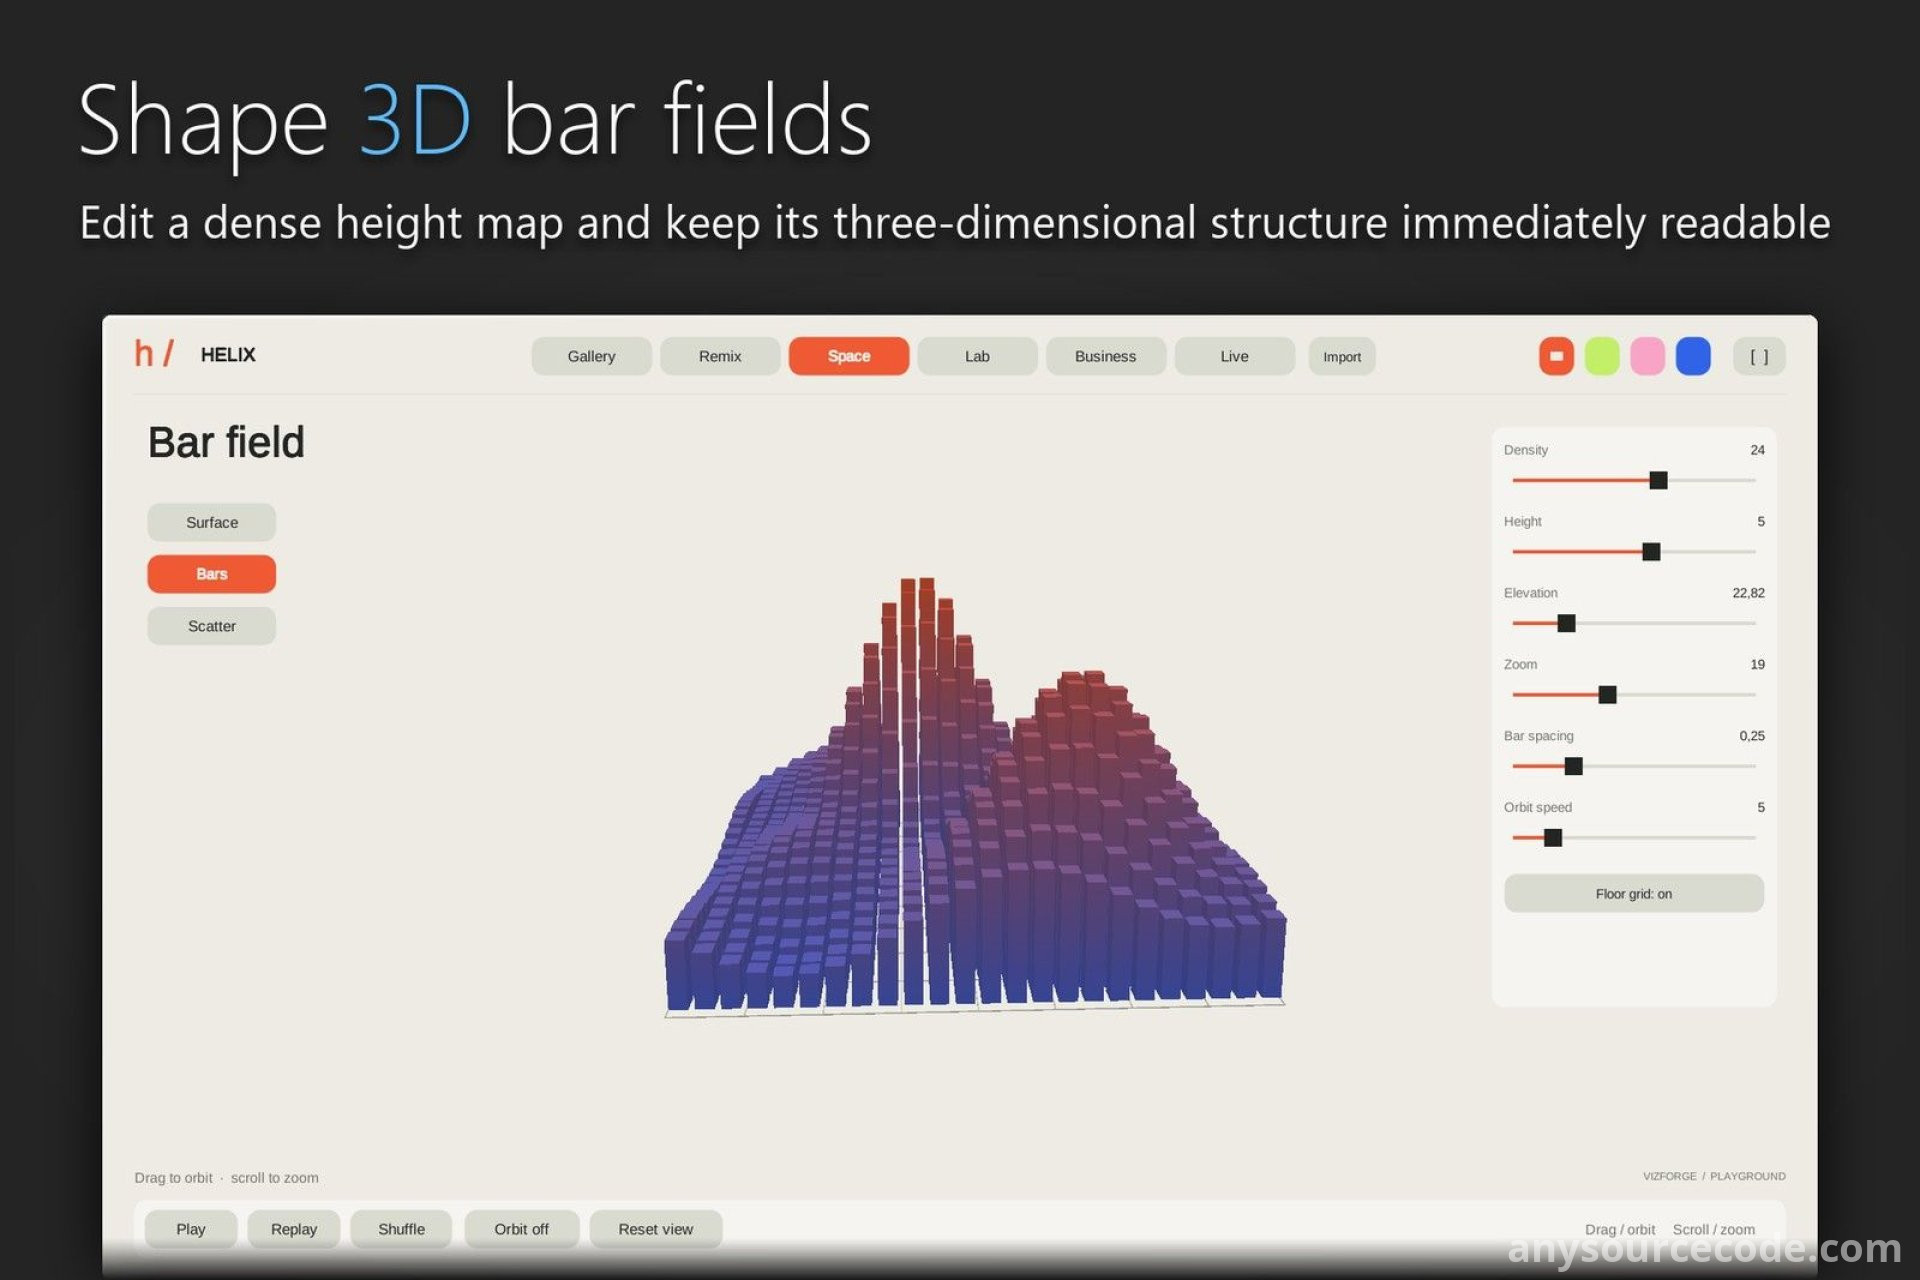
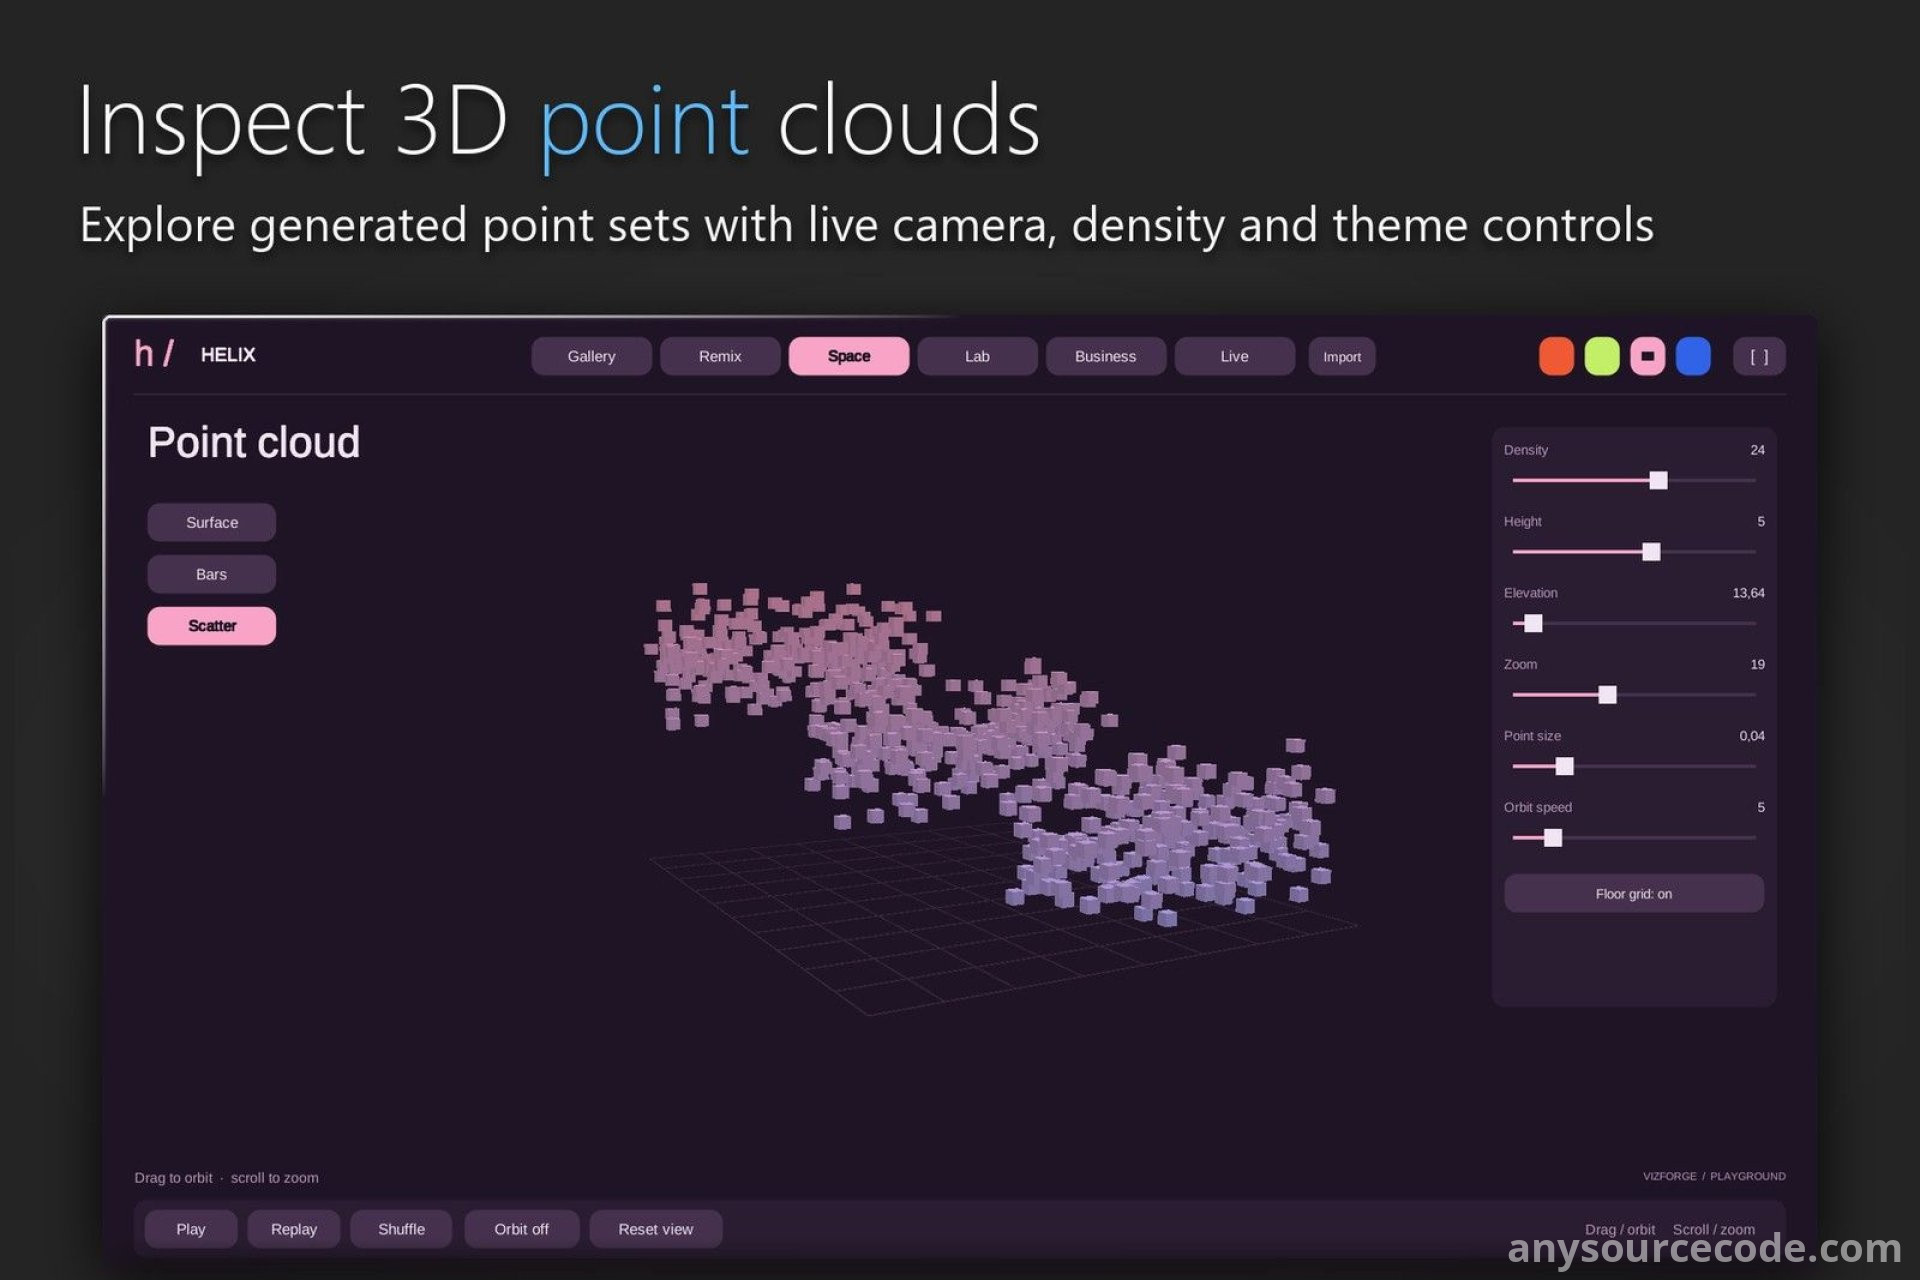
- Adds procedural 3D bar, scatter, and surface charts.
- Provides financial visualizations including candlestick and OHLC charts, volume views, moving averages, Bollinger bands, RSI, and MACD.
- Supports scientific analysis such as curve fitting, smoothing, FFT power spectra, contour generation, clustering, forecasting, and statistical summaries.
- Builds multi-panel dashboards with serializable grid layouts, cross-filtering, pivot tables, KPI scorecards, and hierarchical drill-down.
- Displays live telemetry using fixed-capacity time-series buffers, with included FPS, frame-time, and managed-memory sources.
- Uses a typed columnar data model with number, time, category, Boolean, text, color, and Vector3 values.
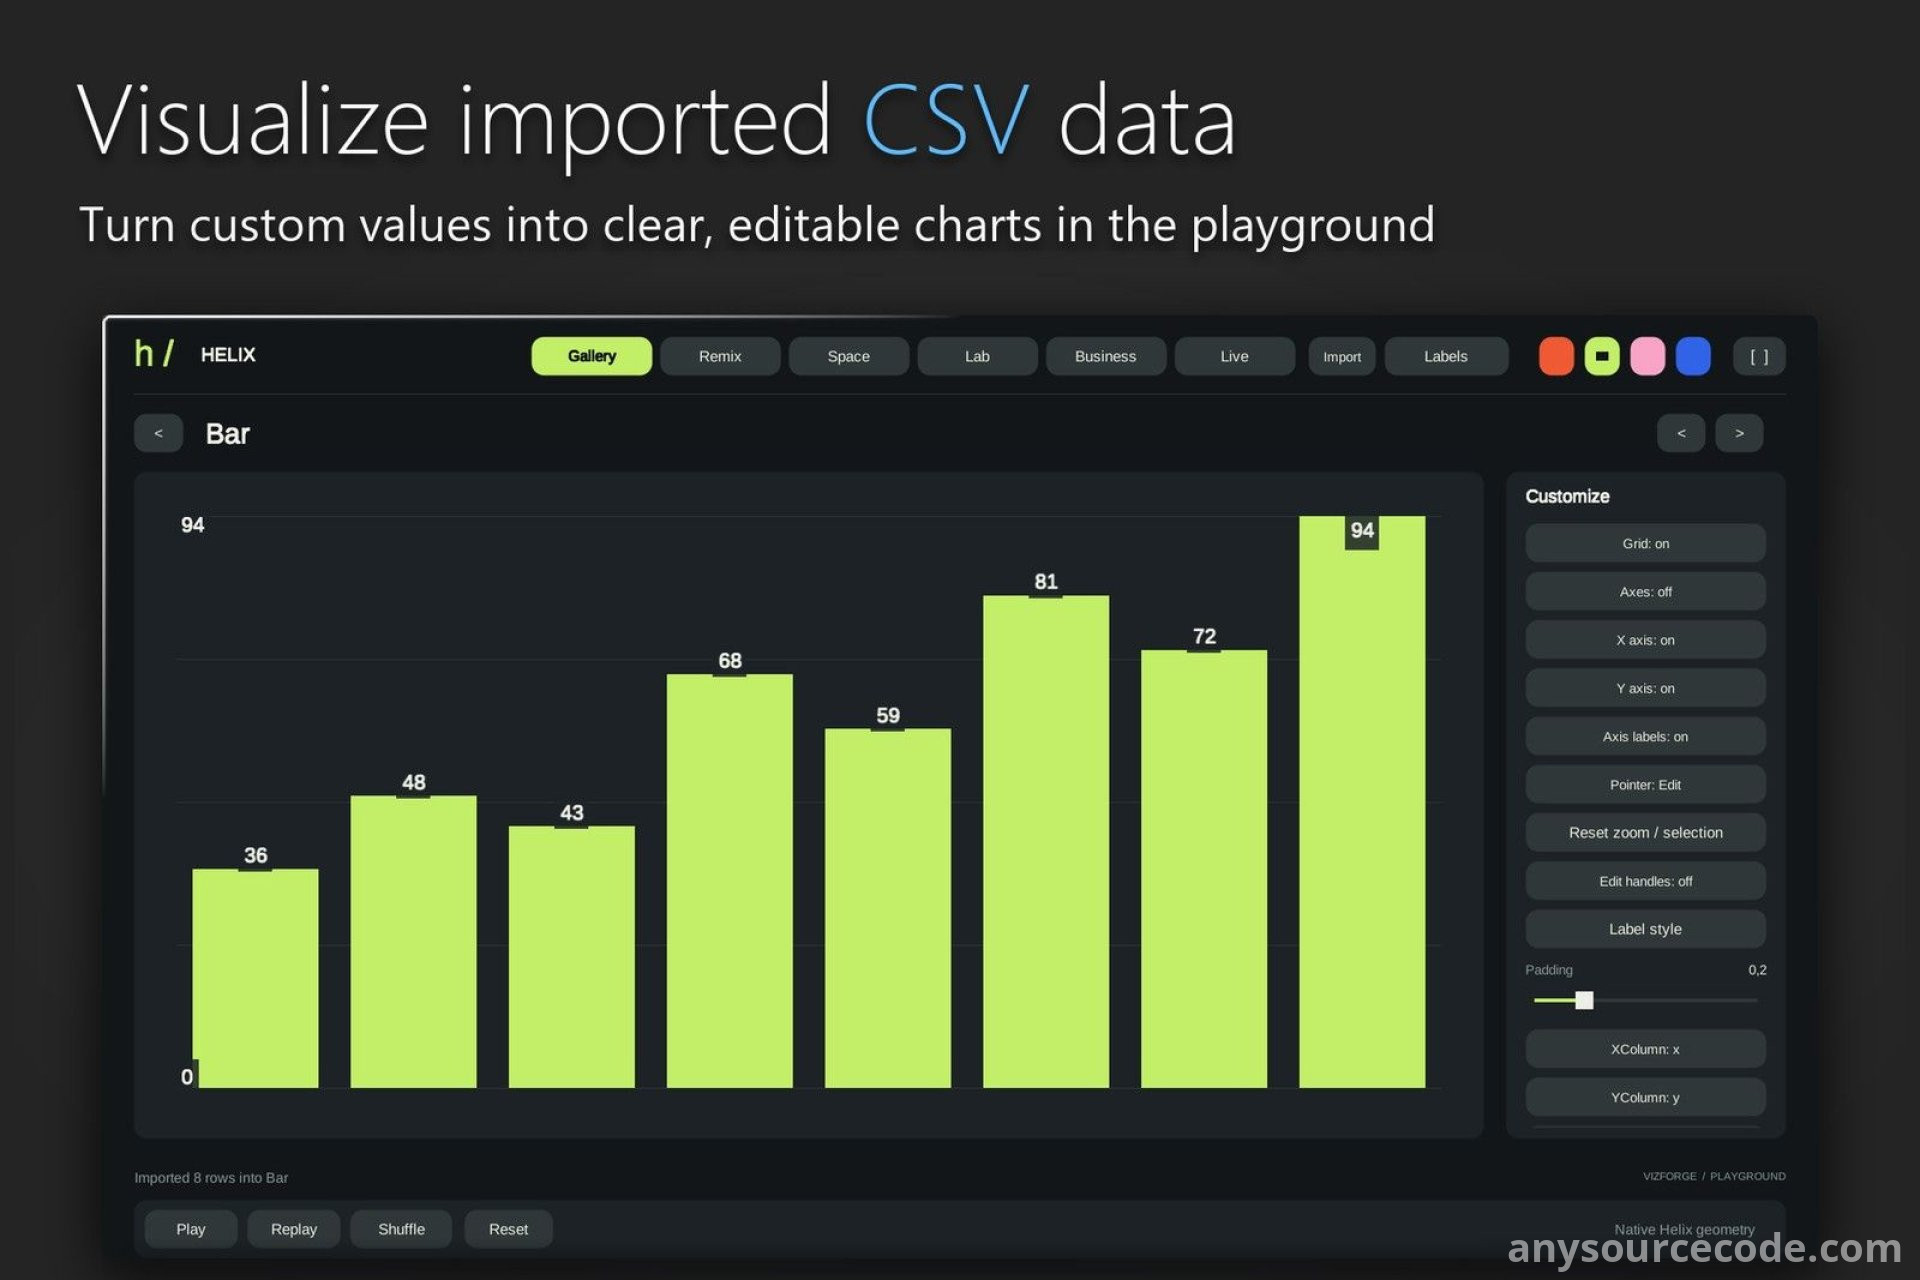
- Imports and exports CSV and JSON, loads remote text, and includes tools for filtering, sorting, mapping, binning, aggregation, and joining data.
- Renders through UGUI, UI Toolkit, and world-space mesh backends using a shared chart pipeline.
- Includes linear, logarithmic, symmetric logarithmic, time, and band/category scales, plus six theme presets.
- Supports runtime theme changes, pan and zoom, hit testing, dashboard cross-filtering, and hierarchical drill-down.
- Exports visualizations as SVG and PNG, data as CSV and JSON, and combines panels into titled reports.
- Includes a Chart Wizard, custom inspectors, asset creation tools, a sample-scene generator, and workflows for both visual setup and scripting.
- Includes 12 sample scenes, a 17-module interactive showcase, searchable HTML documentation, and approximately 470 automated tests.
Platform:
Unity 6000.0.62f1
No reviews found!









No comments found for this product. Be the first to comment!